Posts

Showing posts from July, 2014

Risbey et al. 2014

Image
It seems the canard about how IPCC models are inaccurate just won't go away.  I've covered it before on this blog .  The newest incarnation of that canard revolves around a new paper by Risbey et al. ( 2014 ).  It seems that many just don't understand what Risbey et al. did and they definitely don't understand the results of that paper.

Seasonal trends by hemisphere

Image
A reader raised a good question about my last post .  One of the confirmed predictions of climate change is that winters will warm faster than summers, yet my analysis showed that December-February warmed the least.  The question was why that would be.  The answer is simple: I used global temperature data.  December-February may be winter in the Northern Hemisphere but it is summer in the Southern.  The seasons largely cancel out.  The reason we see faster warming in the June-August  (Northern Hemisphere summer) versus December-February (Southern Hemisphere summer) is due to the position of land masses.  There's a greater proportion of ocean in the Southern Hemisphere and the ocean doesn't change temperature very readily compared to landmasses whereas the Northern Hemisphere has more landmass and consequently a larger response to seasonal changes in insolation.

Seasonal trends

Image
It is almost comical how people will grasp at any straw they can come up with to claim that global warming isn't happening.  The most recent bit of hilarity?  A claim that the winter trend since 2002 is cooling, therefore we're in global cooling, not global warming.  Let's check that one out to see just how ridiculous it is.

What will summers be in AD 2100?

While I'm working on a longer post, here is an interesting interactive graphic from Climate Central .  Just type in the city you are interested in and see what the summers will be for that city in AD 2100. It shows which US city (or world city) currently experiences average summer temperatures as hot as those predicted for selected US cities and gives you an idea of how far north the climate bands will have shifted over the next 86 years. Average summer highs in my current hometown are predicted to warm up by nearly 6.5ºC from the current average high of 29.4ºC to a predicted average high of 35.9ºC.  How much will your closest city warm?

NewsMax, Ambler, and BS about Antarctic sea ice

Image
NewsMax.com printed a poorly writen story about Antarctic sea ice intended to sow confusion amongst its readers which was unfortunately shared on my Facebook timeline by an acquaintance.  However, the article is even worse than being merely poorly written.  The "author," Sandy Fitzgerald, extensively plagiarizes a blog post by Harold Ambler while leaving out nearly everything Ambler wrote about why Antarctic sea ice is increasing.  Fitzgerald manages to make it sound like a new record extent in Antarctic sea ice somehow contradicts global warming.  Ambler's original is a far more nuanced argument.

How low will it go?

Image
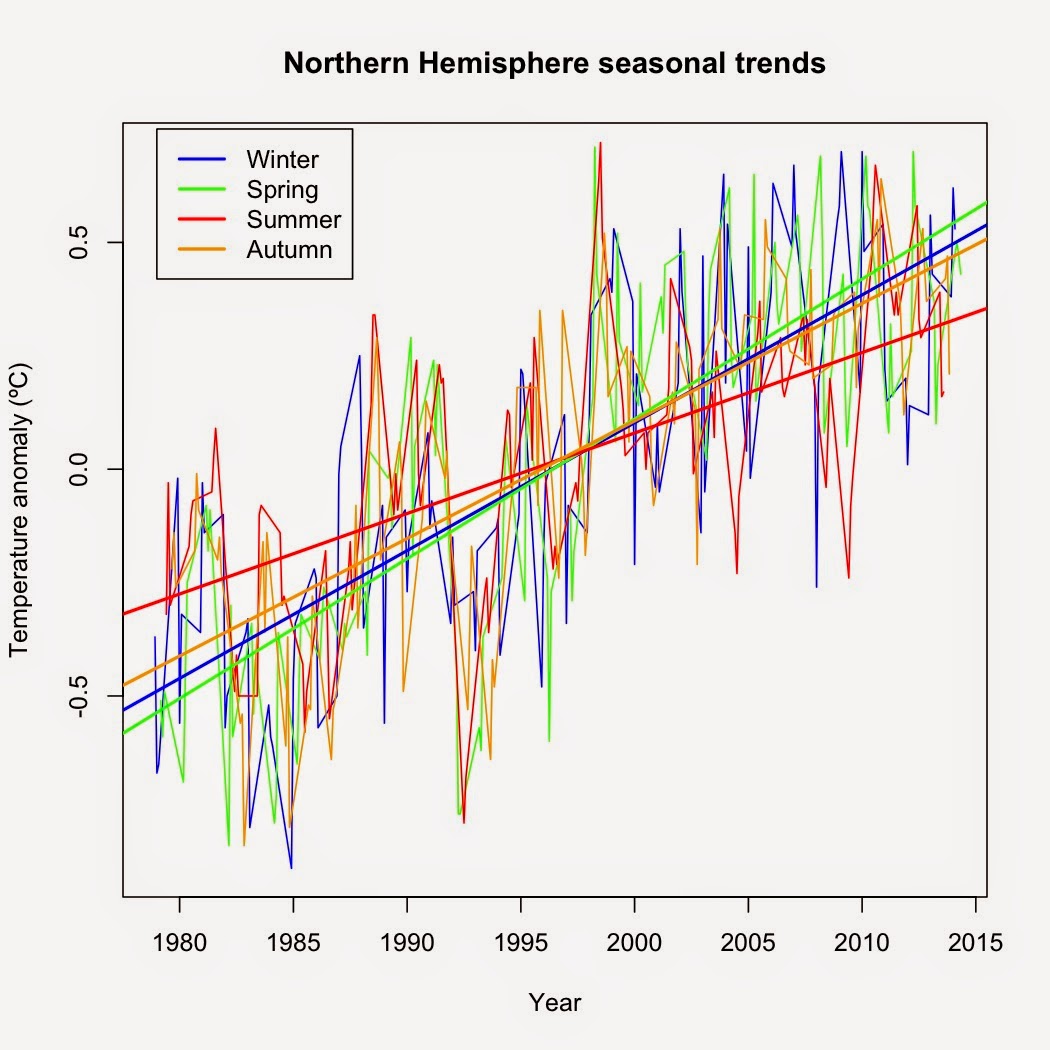
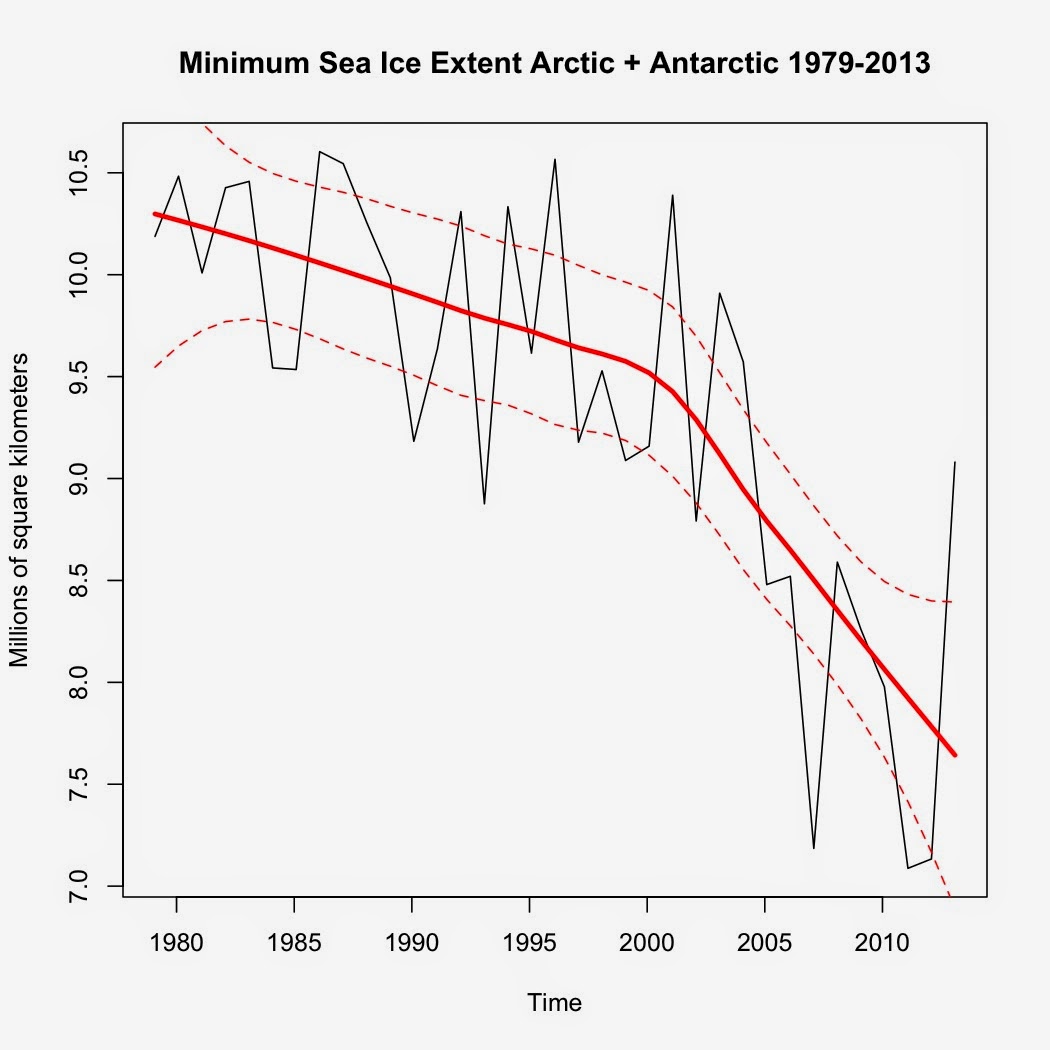
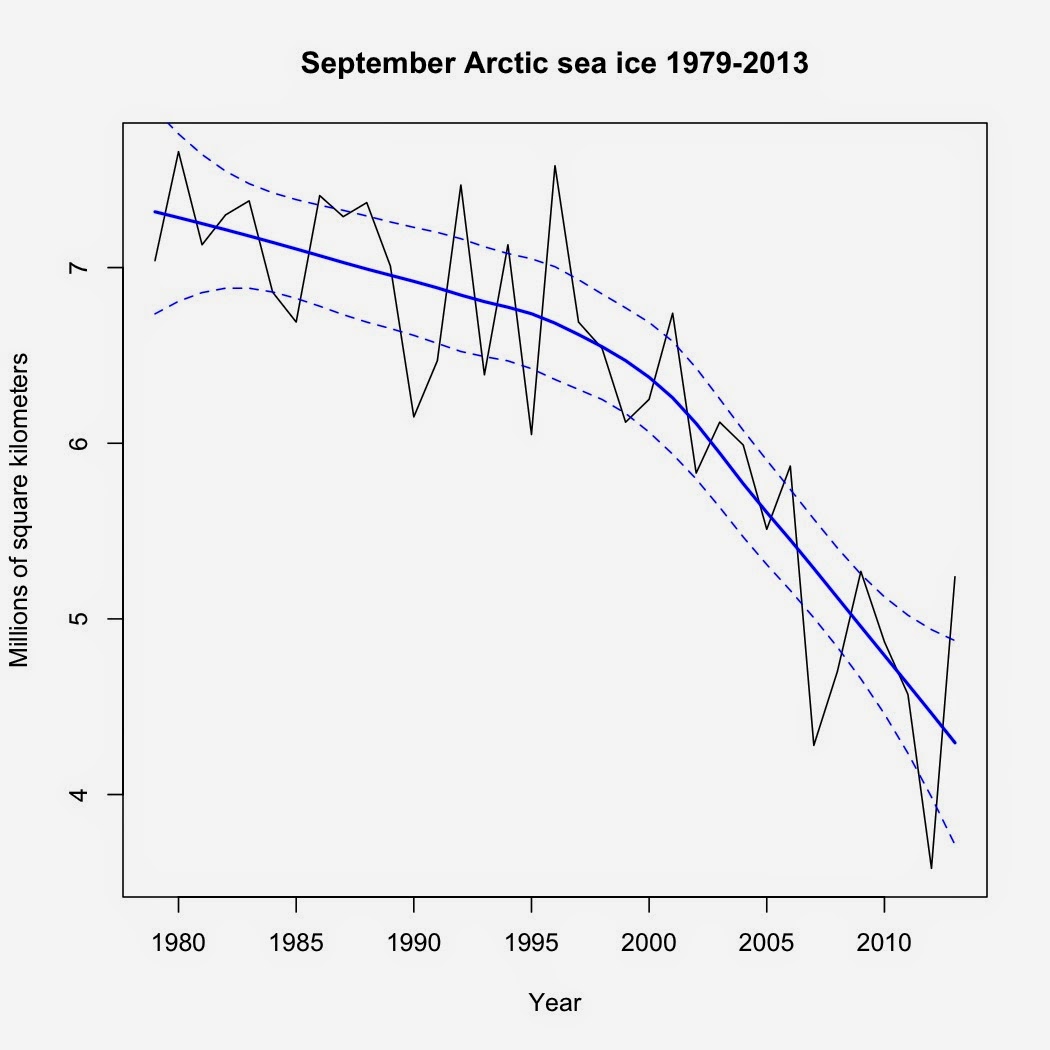
This is the time of year all eyes start turning toward the Arctic, specifically how rapidly and/or much the multiyear sea ice will melt this particular year.  Here is the average sea ice extent for September since 1979: I've added a loess regression line along with 95% confidence intervals to highlight the trend.  Despite last year's rebound from the 2012 low, the overall trend is decidedly down, with less multiyear ice remaining as time goes by. Now on to my prediction of what the ice will do this year.  What I did was simply to extrapolate based on the loess regression, which yielded a prediction of 4.135 million km 2 .  I also fitted a polynomial regression to the data, which produced a prediction of 4.085 million km 2 .  Both are well above the record low in 2012 (3.58 million km 2 ), showing how anomalous the 2012 low was.  If the loess curve holds, I wouldn't expect the trend to fall below the 2012 low until 2018. So, what is your prediction of what the Septe